That Little Graph on Your Electric Bill Is Snitching on You
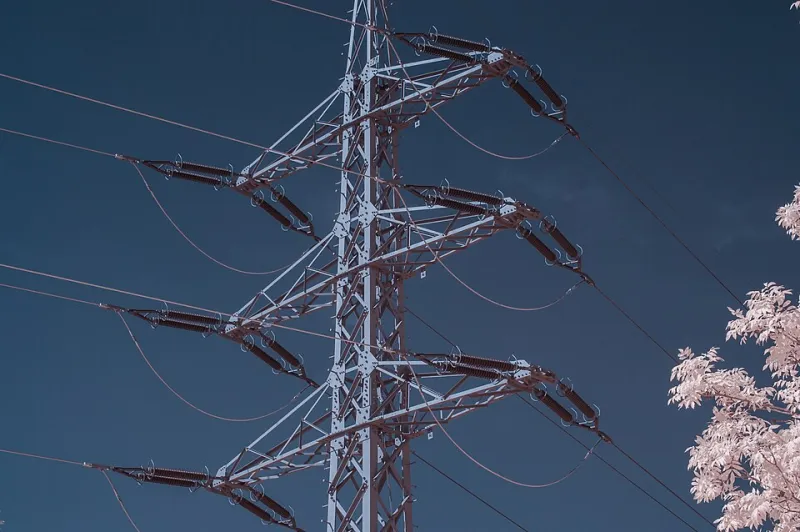
Photo: Fritzchens Fritz, CC0, via Wikimedia Commons
Most of us treat the electric bill like a parking ticket — glance at the number, wince, pay it, forget it. But tucked behind that total is something most people never open: a usage graph. Sometimes it's on the paper statement, sometimes it's buried three clicks deep in your utility's website. Either way, it's there, and it's telling on you.
That graph isn't just data. It's a diary. It knows when you wake up, when you leave, whether you were actually 'working late' last Tuesday, and whether that ancient freezer in the garage is quietly running a second household's worth of load. Learn to read it, and you'll find money you didn't know you were losing.
Step One: Go Find the Graph
Almost every major US utility — PG&E, ConEd, Duke, Georgia Power, Xcel, you name it — offers a free online portal. Log into your account and look for words like 'Usage,' 'My Energy,' or 'Green Button.' The Green Button is the good stuff: it lets you download your actual interval data, often in 15-minute or hourly chunks.
Hourly data is where the confessions happen. A monthly total just says '$184.' Hourly data says '$184, and by the way, something in your house ran at full tilt from 2 to 4 a.m. every night this month.'
Once you've got the graph open, here are the five patterns worth hunting for.
Pattern 1: The 3 A.M. Stalker
Pull up a day view and look at the overnight hours. A healthy home flatlines while you sleep — a low, boring line. If you see a spike at 3 a.m., something is awake that shouldn't be.
The usual suspects: that 25-year-old chest freezer in the garage (older freezers can cost $15–$25 a month to run), a failing fridge compressor, an electric water heater with a leaky tank reheating itself all night, or a well pump short-cycling. Unplug the garage fossil for a week and watch the graph. If the spike vanishes, you just found $200 a year.
Pattern 2: The Phantom Baseline
Look at the lowest point on your daily graph. That's your 'always on' load — the stuff that never turns off. For a typical US home, a healthy baseline is somewhere under 300–400 watts. If your floor sits at 800 or 1,000 watts around the clock, you're paying for a ghost town of idle electronics, gaming consoles in rest mode, and that second fridge nobody opens.
Quick test: shut everything you can think of off, then check the graph the next day. Whatever baseline remains is your phantom load. Smart plugs with energy monitoring (about $12 each) can name the individual culprits.
Pattern 3: The Evening Mountain
See a big climb from 4 to 9 p.m. every day? That's normal life — dinner, laundry, HVAC. Unless you're on a time-of-use (TOU) plan, in which case that mountain is being billed at premium rates, sometimes two to three times the off-peak price.
Check your bill's plan name right now. If it says 'Time of Use,' 'Peak Hours,' or 'TOU-D,' your schedule and your plan may be a bad match. Shift the dishwasher, dryer, and EV charging to after 9 p.m. (or before 3 p.m., depending on your plan) and the same habits cost noticeably less. Some utilities will let you switch back to a flat-rate plan — worth a phone call if your evenings are non-negotiable.
Pattern 4: The Weekend Split Personality
Compare weekdays to weekends. If your weekday usage is tiny and your weekends spike hard, fine — you're at work all week. But if the opposite is true and nobody's home on weekdays, yet the graph barely dips, something is running at full capacity into an empty house. Classic causes: the HVAC set to 'auto' instead of an adjusted schedule, a pool pump on a fixed timer, or a space heater someone forgot about.
Pattern 5: The Weather Excuse Check
Every bill with a high total comes with a shrug: 'It was hot.' The graph lets you fact-check the shrug. Compare this July to last July on the portal — most show year-over-year views. If it was a similar month, weather-wise, but you used 30% more, the weather didn't do that. A clogged filter, a dying AC capacitor, or a new space heater did. This is also exactly the evidence you want before calling your utility to dispute a bill or ask about a high-usage adjustment.
Then Go Get the Money Back
Once you've fixed the leaks, that same data becomes leverage. Call your utility and ask two things: one, am I on the cheapest rate plan for my actual usage pattern? Many utilities won't volunteer this — you have to ask. Two, do I qualify for budget billing, efficiency rebates, or a free home energy audit? Most state-regulated utilities offer audits at no cost, and the interval data you've now studied makes you sound like exactly the kind of customer they take seriously.
The bill will still come every month. But once you can read the graph behind it, you're no longer just a payer — you're the one holding the diary. And you get to edit it.